
Are You Above or Below Average? Today’s Wealth Benchmarks by Age
Money worries keep people awake at night. You’ve probably wondered at some point if you’re on track or falling behind. Let’s be real, comparing yourself to others is natural, even if financial experts tell you not to. Here’s the thing: wealth benchmarks by age actually exist, backed by solid Federal Reserve data from 2024 and 2025.
These aren’t just random numbers, either. They represent real households tracked through comprehensive surveys. So where do you stand?
The Median Net Worth Reality Check

Americans’ median net worth surged 37% to $192,900 between 2019 and 2022, marking the biggest jump since the Federal Reserve started tracking this data in 1983. That sounds impressive until you dig deeper. Net worth averages increase with age from $183,500 for those 35 and under to $1,794,600 for those 65 to 74, according to the latest Federal Reserve Survey of Consumer Finances. The median tells a different story than the average, though. Average wealth can be skewed by a few uber-wealthy individuals, while median net worth better represents the middle-of-the-road consumer. For example, the median net worth in 2022 was $192,900, a 37% increase over the previous three years, but the average clocked in at over one million dollars. Most people aren’t millionaires, which is why the median matters more for your personal comparison.
Younger Generations Are Actually Winning

Forget the broke millennial stereotype. Younger Americans (millennials and Gen Zers, or those born in 1981 or later) had greater household wealth, on average, than Gen Xers and baby boomers did when both generations were close to the same average age. In the fourth quarter of 2024, younger Americans owned $1.23 for every $1 of wealth owned by Gen Xers, on average, at close to the same age. Younger Americans owned $1.35 for every $1 of wealth owned by baby boomers, on average, at close to the same age, according to St. Louis Federal Reserve research. That’s a stunning reversal from years of doom-and-gloom headlines. The average net worth for Millennials hit $333,096, a 12.74% increase in just one year through December 2024.
Housing wealth drove much of this growth. Millennials’ housing wealth grew $2.5 trillion, after accounting for the additional mortgage debt they took on. A colossal jump in home prices benefited owners, whether they scraped together a down payment in the early 2010s or squeaked in just before the recent leap in prices and rates. It’s hard to say for sure, but timing the real estate market accidentally might be the financial break this generation needed. Stock market gains and retirement account growth also played major roles in closing the wealth gap with older generations.
Retirement Savings By Generation Show Massive Gaps

Your 401(k) balance probably looks very different depending on when you were born. For baby boomers, the average 401(k) balance is $249,300 with an average IRA balance of $257,002. For Gen X, the average 401(k) balance is $192,300. The average IRA balance is $103,952, based on Fidelity’s fourth quarter 2024 data. Meanwhile, Millennials have an average 401(k) balance of $67,300. The average IRA balance is $25,109. Gen Z investors have an average 401(k) balance of $13,500 and an average IRA balance of $6,672. These numbers sound discouraging for younger workers, but remember that time matters enormously.
Average 401(k) plan balances reached $148,153 in 2024, up from $134,128 in 2023, according to Vanguard’s comprehensive analysis of nearly five million retirement accounts. The jump reflects strong market performance and increased savings rates. Still, roughly half of American households don’t have any retirement savings at all, which skews the averages upward for those who do participate. The median balance for people just getting started in their careers is $1,948. That means half of 401(k) plan participants in this age group have less than that amount saved and half have more. The average balance is quite a bit higher, skewed by those who are able to save more in their 401(k).
How Much You Should Actually Have Saved

Financial advisors love their rules of thumb. Aim to save at least 1x your income by age 30, 3x by 40, 6x by 50, and 8x by 60. Fidelity’s guideline: Aim to save at least 1x your salary by 30, 3x by 40, 6x by 50, 8x by 60, and 10x by 67. These benchmarks assume you start saving around 15 percent of your income from age 25 and keep at it consistently. Reality rarely cooperates with perfect scenarios. Student loans, medical bills, and life in general get in the way.
Savers in their 30s average $199,600 (103% of the 3× target), while those in their 50s average $617,300 (112% of the 8× target). The 60s cohort is navigating the retirement transition: Average balances of $573,100 are around 88% of the 10× benchmark ($649,572), as some begin withdrawals and others continue working toward their goals, according to Empower’s 2025 analysis. Honestly, seeing these numbers might make you feel better or worse depending on where you land. What matters most is whether you’re trending in the right direction for your personal situation.
The Wealth Concentration Problem Nobody Talks About
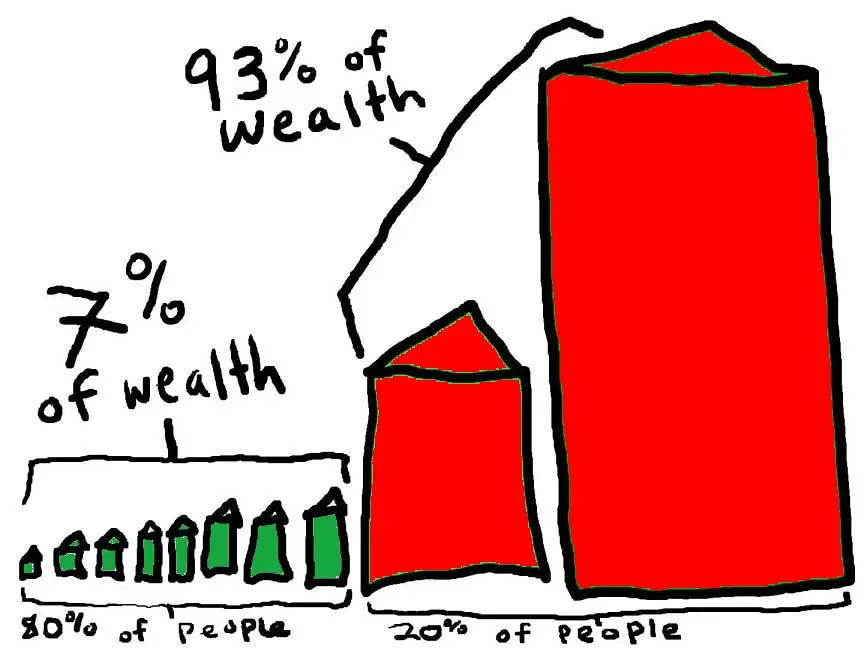
The top 10% of households by wealth had $8.1 million on average. As a group, they held 67.2% of total household wealth. The bottom 50% of households by wealth had $60,000 on average as of the fourth quarter of 2024, per Federal Reserve distributional data. That’s a staggering concentration of wealth at the top. In the first quarter of 2024, 51.8 percent of the total wealth in the United States was owned by members of the baby boomer generation. In comparison, millennials own around 9.4 percent of total wealth in the U.S., even though millennials and baby boomers represent roughly similar population sizes.
The takeaway? You’re probably closer to average than you think, but average isn’t necessarily enough for a comfortable retirement. Small increases in savings rates today compound dramatically over decades. What’s your next move going to be?