If the Next Market Crash Mirrors 2008, Here’s What Portfolios Could Lose
The 2008 financial crisis didn’t just shake Wall Street. It reached into living rooms, retirement accounts, and the savings of everyday families across the globe. It was, as one Bank of England official called it, potentially “the largest financial crisis of its kind in human history.” Most people still associate it with big banks and bailouts. The real story, though, is what it did to ordinary portfolios.
Now, in 2026, that conversation is back. Market valuations are stretched, geopolitical shocks are arriving fast, and recession models are flashing warnings that haven’t appeared in years. So what would actually happen to your portfolio if the next major crash looked anything like 2008? Let’s dive in.
The Sheer Scale of What 2008 Actually Destroyed

Before projecting what a 2008-style crash could do today, it’s worth understanding what it actually did then. The numbers are staggering, even now. Between January 1 and October 11, 2008 alone, owners of stocks in U.S. corporations suffered about $8 trillion in losses, as their holdings declined in value from $20 trillion to $12 trillion.
From its peak in the second quarter of 2007 at $61.4 trillion, household wealth in the United States fell $11 trillion, to $50.4 trillion by the end of the first quarter of 2009, resulting in a decline in consumption, then a decline in business investment. Think about that for a moment. Eleven trillion dollars. Gone. In less than two years.
That downturn led to a 4.3% contraction in GDP, unemployment soaring to 10%, and a long recovery: it took over six years for the labor market to fully rebound and nearly five years for the stock market to return to pre-crisis highs. Recovery was slow, painful, and uneven across income groups.
What Happened to the S&P 500 and Major Indexes
The equity market carnage during 2008 and early 2009 was unlike anything most living investors had experienced. The financial crisis of 2008 meant that most asset classes experienced significant pullbacks, the correlation between asset classes increased significantly, and the markets became extremely volatile. During this time, the S&P 500 lost about 56% of its value from the October 2007 peak to the March 2009 trough.
By March 6, 2009, the DJIA had dropped 54% to 6,469 from its peak of 14,164 on October 9, 2007, over a span of 17 months, before beginning to recover. That’s not a correction. That’s a near-wipeout. Honest, that’s the kind of number that forces people to delay retirement by years.
During September and October 2008, roughly 80% of all trading days saw gains or losses that exceeded 1%, and nearly 60% of all trading days were plus or minus 2%. The S&P experienced daily losses of negative 9.0%, negative 8.8%, negative 7.6%, negative 6.1%, and negative 5.7%. 2008 was unbelievably volatile.
The Devastating Hit to Retirement Accounts

This is where the crisis became deeply personal for millions of Americans. It wasn’t just a financial headline. It was retirement plans evaporating. During 2008, major U.S. equity indexes were sharply negative, with the S&P 500 Index losing 37.0 percent for the year, which translated into corresponding losses in 401(k) retirement plan assets.
Those with more than $200,000 lost more than a quarter of their savings, on average, according to an Employee Benefit Research Institute analysis of 22 million participants in more than 55,000 employer-sponsored 401(k) plans. Investors in the $100,000 to $200,000 range suffered an average loss of 21 percent in 2008. The typical account with $50,000 to $100,000 lost 15 percent.
Target-date funds whose investors were on the verge of retirement experienced losses exceeding 20 percent during the 2008 crisis. Worse still, the financial crisis unearthed another risk: bonds weren’t necessarily a safe place to hide, either. Some funds were burned because they were too aggressive on the fixed income side. Where some target-date funds held short-term bond funds within their fixed income allocations, others held riskier high-yield bond funds, which can move in the same direction as equities.
Housing Wealth: The Other Half of the Wipeout
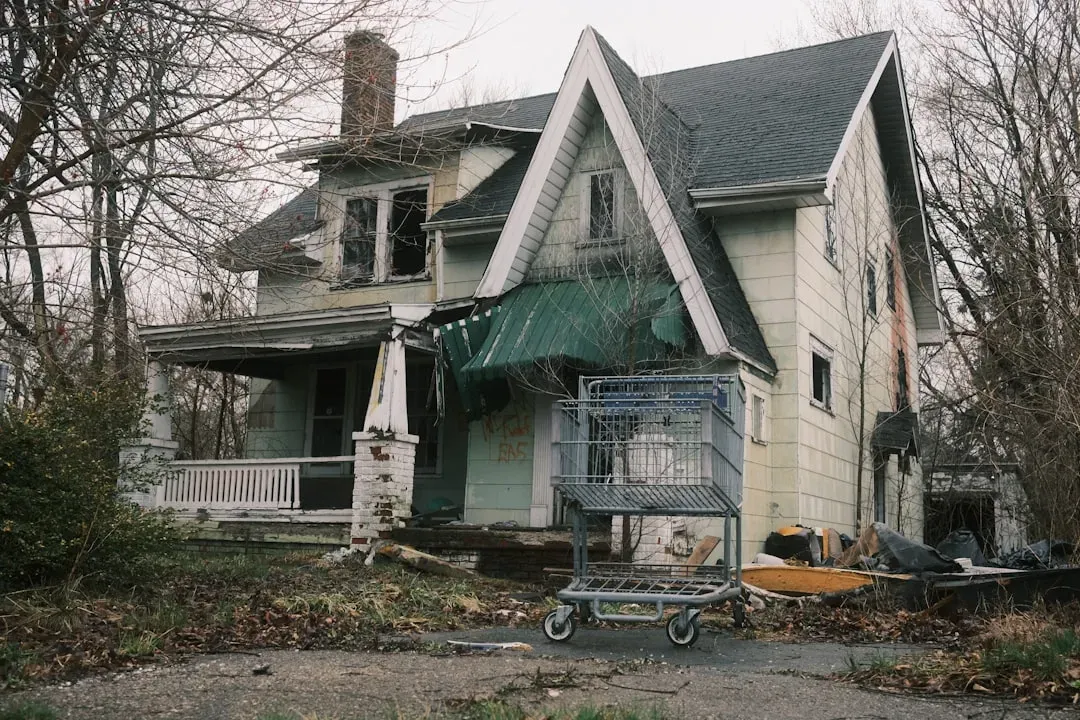
For most American families, a home is not just shelter. It’s the largest single store of wealth they’ll ever have. The 2008 crisis obliterated that too. From 2007 to 2009, the value of real estate owned by U.S. households fell by nearly $6 trillion. That’s a staggering loss in an asset class that most families believed was relatively safe.
Household wealth declined almost $17 trillion in inflation-adjusted terms, or 26 percent, from its peak in mid-2007 to the trough in early 2009. Looking at individual asset categories, the inflation-adjusted value of households’ real-estate holdings declined 26 percent ($5.4 trillion), while stock-market equity holdings declined in value by 51.5 percent ($10.8 trillion) after adjusting for inflation.
Between 2007 and 2011, one fourth of American families lost at least 75 percent of their wealth, and more than half of all families lost at least 25 percent of their wealth. Here’s the thing: those aren’t Wall Street bankers. Those are nurses, teachers, and construction workers who spent decades building something, only to watch it disappear in a few quarters.
Who Got Hit the Hardest, and Why That Matters Now

Losses during the 2008 crisis weren’t distributed evenly. The data tells a more complex and frankly more troubling story. The Federal Reserve surveyed 4,000 households from 2007 to 2009, and found that the total wealth of 63% of all Americans declined in that period, and 77% of the richest families had a decrease in total wealth, while only 50% of those on the bottom of the pyramid suffered a decrease.
These wealth losses were not distributed equally. While large absolute amounts of wealth were destroyed at the top of the wealth distribution, households at the bottom of the wealth distribution lost the largest share of their wealth. In other words, the poorest families often lost a much higher percentage of what little they had. Think of someone who had $30,000 in net worth before 2007, mostly tied up in a home. When that home lost value, they lost almost everything.
The financial crisis had a much bigger effect on the retirement incomes of high than low socioeconomic groups because high socioeconomic groups had the most at stake. At age 67, income from retirement accounts and financial assets makes up 58 percent of average household income for middle boomers in the top income quintile but only 13 percent for middle boomers in the bottom quintile.
The 2026 Risk Environment: Are We Heading Somewhere Similar?
So why does any of this matter right now, in 2026? Because the warning signs that financial analysts track are flashing at historically alarming levels. The Buffett Indicator hovers near 217 to 228% of GDP, while the CAPE ratio has climbed to 39.8, its second-highest reading in 150 years of market history. For context, the Buffett Indicator exceeded the dot-com peak of 150%.
After the S&P 500 gained more than 16% in 2025, investors entered 2026 hoping for more of the same, but that hasn’t happened. The large-cap stock index is down roughly 7% year to date, while the Dow Jones Industrial Average has slipped about 8%, and the tech-heavy Nasdaq Composite has fallen more than 10%.
Moody’s just revealed that the firm’s AI-driven recession model now puts the probability of a U.S. recession at 49%. While that sounds like a coin toss, when backtested over 80 years of data, every time the model’s odds crossed the 50% line, a recession followed within a year. I’ll admit, that particular data point kept me reading for a long time.
What a 2008-Style Crash Would Mean for Today’s Portfolios

If a crash of similar magnitude were to happen today, the math is sobering. A roughly 50% drop in the S&P 500, mirroring the 2007 to 2009 bear market, would affect a far larger pool of invested wealth than existed in 2008. Market concentration risk is particularly acute: the top 10 companies currently comprise over 35% of S&P 500 weight. That level of concentration means a sharp sell-off in mega-cap tech could trigger cascading losses across almost every broad portfolio.
Tech stocks remain the cornerstone of global equity markets, but that strength is increasingly under scrutiny. While the “Magnificent Seven” helped lift indices earlier, concerns are mounting about stretched valuations. The tech sector now makes up about 33.9% of the S&P 500’s market cap, and trades at roughly 29.7 times forward earnings, versus 22.2 times for the index overall.
Somebody who had 50% of their money invested in bonds and 50% in stocks in 2008 would have lost 15.88 percent. That would sting, but it wouldn’t ruin you. Yet an all-equity portfolio, or one heavily concentrated in tech, is a fundamentally different story. In a 2008-style crash scenario today, a portfolio with 80% or more in equities could realistically see losses approaching or exceeding 40 to 50%, based on historical precedent.