Why These 11 Once-Elite U.S. Neighborhoods Are Rapidly Losing Value
Something remarkable is happening in American real estate right now. Places that were once considered bulletproof investments, ZIP codes that people fought tooth and nail to get into, are quietly shedding value in ways that haven’t been seen in over a decade.
This is not the 2008 crash. Nobody’s talking about a systemic collapse. But the numbers are hard to ignore. Home values are falling for more than half of U.S. households, with new research from Zillow showing that 53% of all U.S. homes lost value since last year, the highest share since 2012, the tail end of home value declines after the Great Recession. For once-elite neighborhoods, the fall can feel especially sharp. So which areas are hurting most, and why? Let’s dive in.
1. SoMa and Mission Bay, San Francisco – The Tech Exodus Effect

Few places symbolize the boom-to-bust story quite like San Francisco’s South of Market district and Mission Bay. These neighborhoods were ground zero for the tech money wave, packed with luxury condos, startup offices, and coffee shops charging $8 for a latte. Honestly, they felt invincible for a decade. Then reality arrived.
The largest drops occurred in neighborhoods that rely heavily on condo sales, especially Mission Bay, SoMa, South Beach, Lower Nob Hill, and the Van Ness corridor, where many areas experienced year-over-year price declines in the ten to fifteen percent range, according to Zillow and Compass data. The driver is straightforward enough: hiring in the Bay Area tech sector cooled significantly during 2023 and early 2024, with companies such as Google, Meta, Amazon, and Salesforce putting in place hiring freezes and layoffs, meaning fewer new workers were relocating and demand for higher-end units cooled.
More than 80 percent of homes in the San Francisco metro area lost value this year, according to Zillow. That’s a staggering figure. South of Market home values were down 12.2% in early 2025 compared to last year, and homes typically sell for 3% below list price. For buyers who paid peak prices in 2021 and 2022, that is not a paper loss anymore. It’s a real one.
2. Pacific Heights, San Francisco – Even the Prestige Zip Codes Aren’t Safe
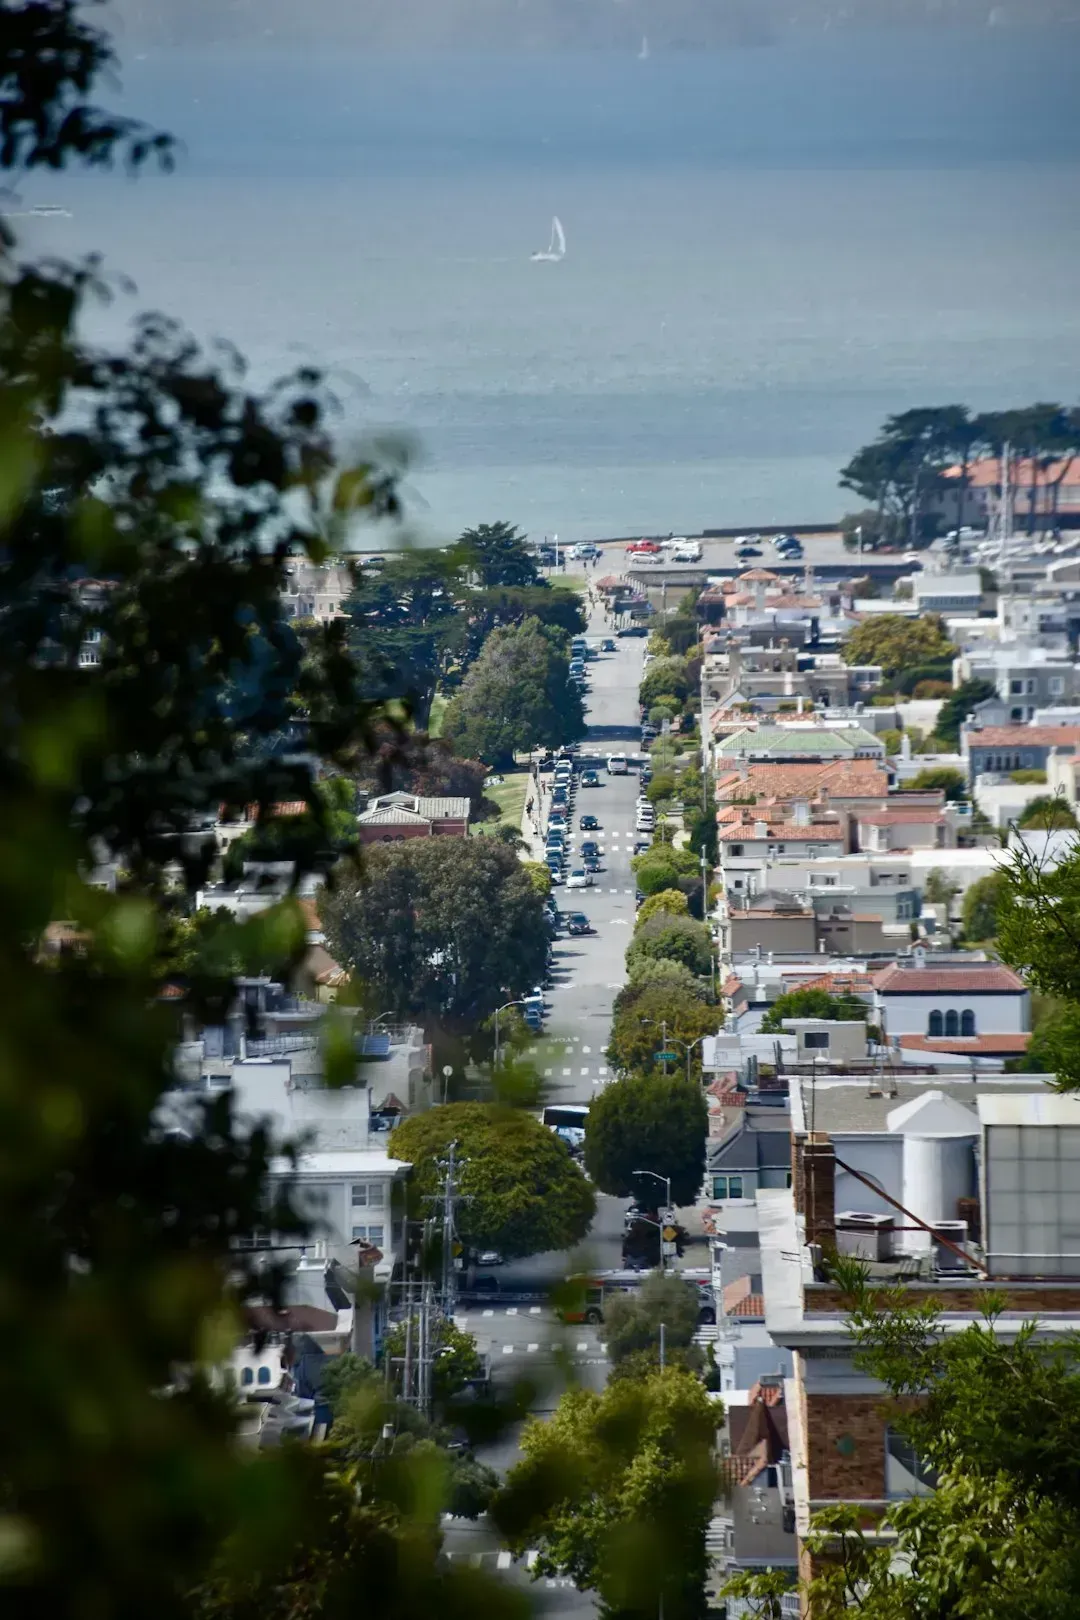
Pacific Heights is not SoMa. This is old-money San Francisco, the kind of neighborhood with grand Victorian mansions, sweeping views of the bay, and the sort of quiet dignity that wealthy buyers have sought for generations. If any part of the city should hold its value, you’d bet on Pacific Heights. Yet even here, the market has stumbled.
While still pricey, Pacific Heights has seen home prices drop a significant 40.6% year over year as of early 2025, and properties typically sell for 1% below their asking price. That number is striking, though it partly reflects the high volatility of luxury-tier transactions. San Francisco County saw drops of about 15 percent over three years in many downtown tracts, with some neighborhoods already falling more in this downturn than during the 2007 to 2012 slide.
San Francisco presents a tale of two markets, with single-family homes maintaining their value while condo values have declined by 12.52% over the same period, highlighting buyer preference for detached homes over shared buildings. The lesson here is that prestige alone is no shield when broader economic forces shift beneath a neighborhood’s feet.
3. Austin’s East Side – The Boom That Went Too Far

Austin’s East Side went from scrappy and affordable to impossibly trendy in the span of about six years. Murals, cocktail bars, record shops, and a wave of tech transplants from California turned this once-overlooked corridor into one of the most hyped real estate stories in America. Then the laws of economics arrived, as they always do.
Austin is the poster child for this dynamic: its boom was extreme, its pipeline was heavy, and its repricing has been unusually sharp, with Zillow’s metro data showing meaningful declines into late 2025. The numbers at the metro level are downright shocking. Prices declined year-over-year in 22 of the 33 major metropolitan statistical areas tracked by Wolf Street in November 2025, with Austin-Round Rock-San Marcos recording the single biggest drop at negative 23.6% from peak.
In the ten years through mid-2022, Austin home prices had shot up by 126%, while wages of workers covered by unemployment insurance rose by only 34%, illustrating why these crazy home-price spikes are not sustainable and how they trigger demand destruction, plunging sales, and surging inventories. The overbuilding that fueled that party is now the hangover. The surge of new home construction led to supply outpacing demand, which is why home values in the area are expected to continue falling.
4. Denver’s Highlands and LoHi – A Rocky Mountain Correction
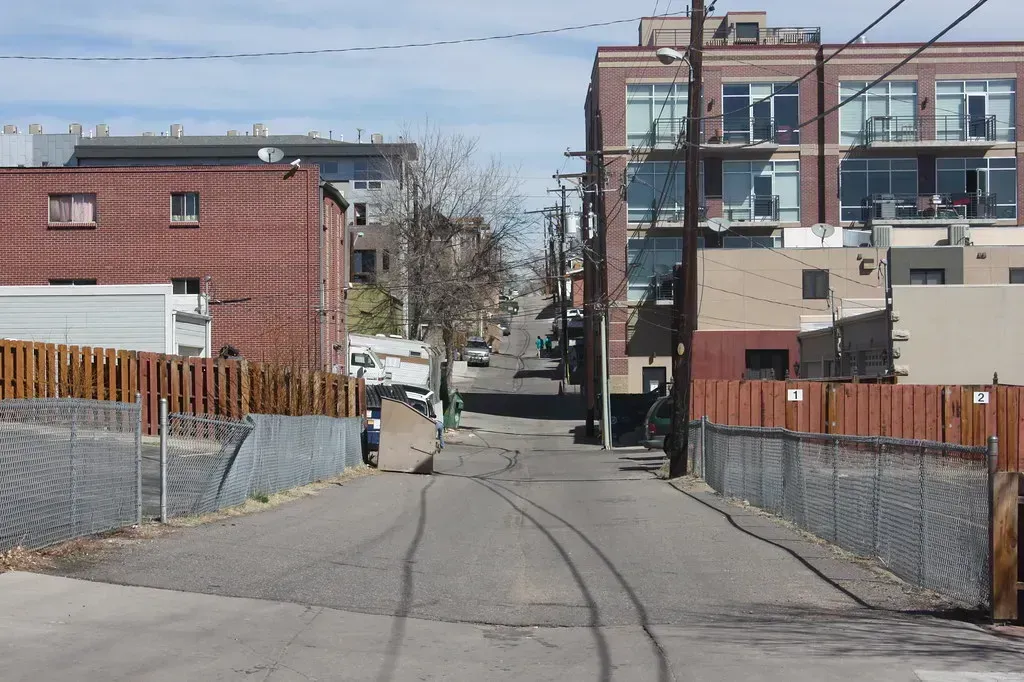
Denver’s Highlands and Lower Highlands neighborhoods were, for a long time, the darlings of the Colorado real estate scene. Walkable streets, farm-to-table restaurants on every corner, craft breweries, and a proximity to outdoor recreation that lifestyle magazines celebrated endlessly. Home prices reflected every bit of that enthusiasm.
The correction has been brutal by local standards. Denver topped the list of cities with the most widespread home value losses, with 91% of homes declining in value over the last year as measured by Zillow. That is not a small slippage. That is an almost citywide repricing event. Prices declined year-over-year in Denver by about 3% in October 2025 according to the Zillow Home Value Index, alongside Tampa, Austin, Miami, Orlando, Dallas, Phoenix, San Antonio, and Atlanta.
Property values are linked to the real estate market, which has been slowed by high interest rates since the Federal Reserve raised them to curb inflation in a post-pandemic world. Denver’s affordability was always stretched thin even by Colorado standards, so when rates rose, the math stopped working for a large swath of buyers. Markets that have seen large increases in negative equity shares include Denver, CO, alongside Houston, TX, Los Angeles, and Las Vegas.
5. Phoenix’s Arcadia and Scottsdale Corridors – The Sun Belt Cools Down

Phoenix spent the early 2020s as perhaps the single hottest real estate market in the entire country. Neighborhoods like Arcadia and the Scottsdale border area attracted remote workers, retirees, and investors from the coasts, all chasing relatively affordable luxury under perpetual sunshine. The feeding frenzy made prices feel like a runaway train.
Phoenix saw home prices rise sharply during the 2020 pandemic, but now faces a potential decline as demand slows and inventory increases. That decline has materialized in a meaningful way. Tampa saw the biggest decline in home values among the major metros analyzed in the latest S&P Cotality Case-Shiller Index, followed by Phoenix at negative 1.68 percent, Miami at negative 1.66 percent, and San Francisco at negative 1.54 percent.
Many metros in the Sun Belt and West, including Tampa, Phoenix, and Las Vegas, are showing clearer signs of softening: inventory is recovering more rapidly, homes are taking longer to sell, and price cuts and delistings are becoming more prevalent. Here’s the thing about Phoenix specifically: it attracted a lot of investor-driven demand in 2021 and 2022. A meaningful share of Sun Belt demand during the boom was investor-driven, covering single-family rentals, short-term rentals, and second homes, but when yields compressed and financing costs rose, investors stopped being price-insensitive bidders and sometimes became net sellers.
6. Miami Beach – Paradise Under Pressure

Miami Beach is still glamorous. Let’s not pretend otherwise. But beneath the Instagram-perfect skyline and the luxury condo towers lies a growing financial anxiety that is reshaping who can actually afford to live, and more importantly stay, here. Insurance costs alone have become a story in themselves.
Miami policyholders faced a staggering 322% premium increase in 2024, and more than half of Floridians worry about homeowners insurance affordability, with between 15 and 20 percent of homeowners uninsured. Combine that with flood risk and it becomes a very different calculation. More than one third of homes in Miami-Dade County face high flood risk, and rising seas are already pushing salt water onto streets and into groundwater.
Redfin’s 2025 climate migration analysis reveals that Miami-Dade County, where 36.3 percent of homes face high flood risk, experienced a net domestic outflow of 67,418 people in 2024. People aren’t leaving because Miami is unlovable. They’re leaving because the cost of staying, factoring in insurance, flood risk, and rising carrying costs, has simply become unmanageable for many. A Cotality study found that homes sitting within Miami’s 100-year flood zone saw a reduction in value of between 9% and 18% per square foot.
7. Tampa’s Hyde Park and Bayshore – Hurricane Hangover
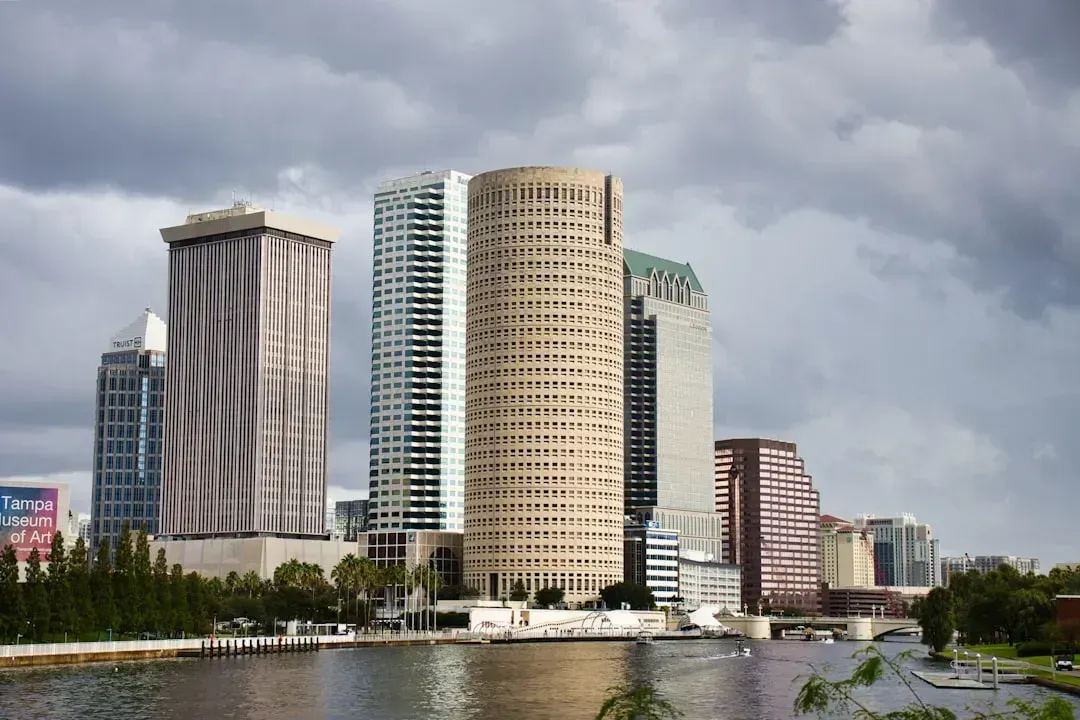
Tampa’s Hyde Park and Bayshore Boulevard represent some of the most coveted real estate in all of Florida. Beautiful historic homes, waterfront views, walkable streets, and a sense of civic pride that few Florida neighborhoods can match. It felt, for years, like Tampa was finally getting its moment. Then the storms came.
In 2024, Florida suffered back-to-back major storms, with Hurricane Helene hitting as a Category 4 in late September and Milton arriving as a Category 3 in early October, causing tens of billions in damage, with Munich Re estimating $56 billion total loss from Helene and $38 billion from Milton. Tampa took the worst of it, and the market has reflected that pain ever since. Tampa led the year-over-year price declines among the 22 major metros tracked by Wolf Street in October 2025, with a drop of 6.3%.
In southwest Florida, rising insurance costs have started to depress home values, which can drive down property-tax revenue to local governments. It’s a vicious cycle, honestly. In 2025, market data shows average days on market for coastal homes in Florida have doubled compared to waterfront properties in 2024, a clear sign of buyer hesitation. Buyers haven’t disappeared, but they are negotiating harder than ever before.
8. Dallas’s Uptown and Oak Lawn – Texas Triangle Trouble
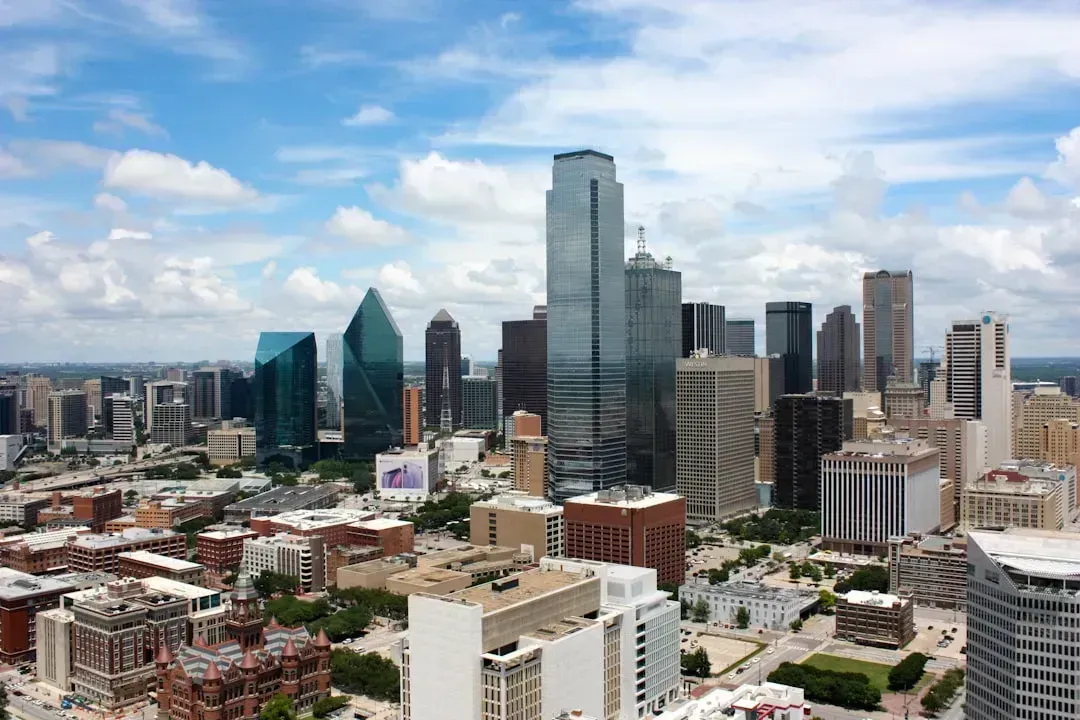
Dallas’s Uptown and Oak Lawn districts spent years riding one of the cleanest property appreciation stories in the Sun Belt. Young professionals, corporate relocations, gleaming new construction, and a business-friendly state tax environment made Dallas look like a can’t-lose market. The city attracted relocations from California and New York at a remarkable pace.
Median home prices in Dallas declined by 2.3% year-over-year, with homes sitting on the market for an average of 42 days. That figure has deteriorated further since then. Dallas posted a year-over-year price decline of about 4% in October 2025 in the Wolf Street tracking of major metro home values. The oversupply problem is significant here too.
New supply arrives with a lag, as permitting decisions made in 2021 and 2022 can translate into completions and competition in 2024 and 2025, and when listings rise, sellers lose leverage and price cuts spread, especially in markets where buyers have lots of near-substitutes like new subdivisions, new multifamily, and investor inventory. Dallas built a lot during the boom years. Now all that inventory is coming due at the worst possible moment for sellers. These crazy home-price spikes are not sustainable; they trigger demand destruction, plunging sales, and surging inventories, a scenario now playing out in Texas.
9. Sacramento’s Midtown – The Spillover City Retreats
Sacramento had the great fortune, or misfortune depending on how you look at it, of being positioned as the affordable alternative to the Bay Area. When San Francisco prices went stratospheric, a wave of buyers flooded into Midtown Sacramento, convinced they were getting a bargain. Prices rose accordingly, and fast.
Denver topped the list of cities with the widest home value declines at 91%, followed by Austin at 89%, Sacramento at 88%, Phoenix at 87%, and Dallas at 87%, according to Zillow’s late 2025 data measuring the share of homes declining in value year over year. Sacramento’s correction is closely tied to the Bay Area’s own slowdown. When the jobs that were pushing Bay Area workers outward began to shrink, Sacramento lost its primary buyer pool.
Cooling home prices have dominated narratives about U.S. housing trends over the course of 2025, and after multiple years of double-digit home price appreciation during the COVID-19 pandemic, prospects for future price growth are anchored by low affordability conditions sidelining borrowers, especially first-time homebuyers. Sacramento was a city that attracted exactly those buyers, the hopeful first-timers and the Bay Area spillover crowd. Both groups have retreated significantly, leaving sellers in a difficult spot.
10. San Antonio’s King William and Alamo Heights – The Quiet Correction

San Antonio doesn’t make as many headlines as Austin or Dallas. It’s quieter, a bit more understated, the kind of city that real estate investors were recommending as a safe bet well into 2023 because it hadn’t gotten as frothy. The historic King William district and the leafy streets of Alamo Heights attracted buyers who prized authenticity over hype. I understand the appeal completely.
In San Antonio, the market is cooling due to an oversupply of homes, with a 2.7% decrease in median home prices year-over-year, as the surge of new home construction has led to supply outpacing demand. Among the metros with the largest share of listings priced below their last sale, San Antonio appears at 8%, alongside San Francisco at 14%, Austin at 13%, San Jose at 9%, and Dallas at 7%.
In Florida metros and Sun Belt cities in particular, nonmortgage carrying costs such as insurance and taxes can change the affordability equation even if the sticker price looks down only a few percent. San Antonio is navigating that exact dilemma right now. Property tax bills in Texas have risen significantly, and combined with elevated insurance costs, the total cost of ownership in once-desirable neighborhoods has quietly become hard to justify for many buyers.
11. Washington D.C.’s Capitol Hill and Navy Yard – Federal Uncertainty Takes Its Toll

Washington D.C.’s Capitol Hill and the revitalized Navy Yard waterfront district were two of the East Coast’s great real estate success stories of the 2010s. Government employment, proximity to federal agencies, and steady demand from policy professionals and lobbyists made D.C. seem immune to normal market cycles. For a long time, it really was.
Washington’s housing market was predicted to see a notable decline, with a lack of buyers due to mortgage rates and economic issues cited as the main culprits. The federal workforce dynamics have added a new layer of uncertainty in 2025 and 2026, as shifts in government employment directly affect the buyer pool that has historically kept D.C. neighborhoods humming. In April 2025, federal program changes signaled a significant shift in the housing safety net that had protected many D.C.-area homeowners.
Prices in November 2025 declined year-over-year in 22 of the 33 major metropolitan statistical areas tracked by Wolf Street, up from just 6 at the end of 2024, and the D.C. area has not been spared. The broader macro reality is that the mortgage market remains challenging. The average starter home mortgage payment hit $3,544 in 2025, about 93% more than the average rent, a gap that keeps aspiring buyers locked out and leaves sellers waiting longer than they’d like. For once-elite D.C. neighborhoods, the holding pattern feels increasingly uncomfortable.