Why Some Large Homes Are Sitting Vacant in Today’s Housing Market
Something strange is happening across America right now. Sprawling four and five bedroom homes sit empty on quiet cul-de-sacs, their listing photos gathering digital dust month after month while families in smaller cities desperately hunt for anything they can afford. It feels like a contradiction – and honestly, it kind of is. A housing market supposedly short on supply, yet littered with large homes that nobody seems to want.
The reasons behind this paradox go deeper than a single headline could capture. Interest rates, demographics, outdated pricing, and a fundamental mismatch between who needs housing and what is actually available have all collided in ways few people expected. So let’s dive in, because the full picture is a lot more fascinating than you might think.
A Market Stuck in Place: The Big Picture
The U.S. housing market slump dragged into its fourth year in 2025, with sales remaining stuck at a 30-year low as rising home prices and elevated mortgage rates kept many prospective home shoppers out of the market. That’s not a minor slowdown – that’s a market in deep paralysis. Think of it like a busy highway that just stopped moving in all directions, with everyone sitting in their cars wondering who caused the jam.
Sales of previously occupied U.S. homes totaled 4.06 million last year, essentially flat versus 2024, when sales sank to the lowest level since 1995. Sales have been stuck close to a 4-million annual pace going back to 2023, well short of the 5.2-million annual pace that has historically been the norm. That missing volume represents millions of households stuck in limbo – and it has real consequences for who ends up owning what kind of home.
The Mortgage Rate Lock-In Trap

Here’s the thing that really explains why so many larger homes aren’t moving. Millions of owners locked in historically low mortgage rates during the pandemic boom and are now financially frozen in place. The survey results point to a well-entrenched lock-in effect, where homeowners are unwilling to give up the historically low mortgage rates they secured during the pandemic and take on significantly higher ones today.
A Bankrate survey found that about half of U.S. homeowners say they would be uncomfortable purchasing another home no matter what happens with mortgage rates in 2025. Meanwhile, more than half say there is no mortgage rate at which they would feel comfortable selling their home this year. An FHFA report concluded that the so-called rate lock-in effect prevented 1.72 million home sales between the second quarters of 2022 and 2024. That is a staggering number of transactions simply wiped from the board.
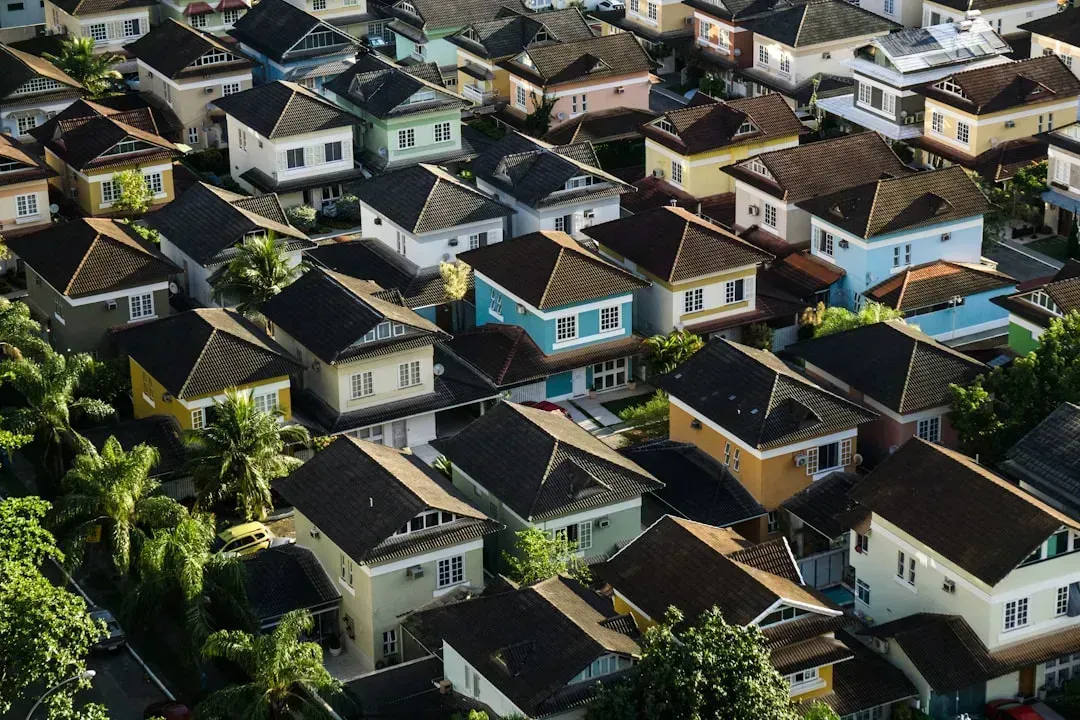
Boomers in Big Houses: A Demographic Mismatch
I think this is where the story gets really interesting. There is a profound generational disconnect at the heart of the large-home vacancy problem. A 2024 Redfin survey found that nearly 80 percent of Baby Boomers age 60 and older own the home they live in, of which over half have no mortgage. Seventy-one percent of Boomer owners plan on aging in place, including empty-nest Boomers who own 28 percent of the entire stock of three-plus bedroom homes.
A follow-on 2025 Redfin survey found that 88 percent of Boomer-owned homes are single-family homes, and these homes are twice as likely to be large homes compared to Millennial homeowners. Only 4 percent of these Boomers had a minor child living with them, despite owning a larger home. So you have millions of enormous houses occupied by one or two retirees who have zero intention of leaving. The families who actually need the space can’t get to it.
Overpricing: The Slow-Motion Mistake
Large homes have another problem that often gets overlooked. Sellers, particularly in the upper brackets, tend to overestimate what their properties are worth, and the market punishes them for it mercilessly. In 2024, ultra-luxury properties in the United States took 400 percent longer to sell than the average home, and were listed up to 25 percent higher than market value. While a median house takes less than 60 days to sell, ultra-luxury properties averaged nearly one year.
In 2024, properties selling in less than 180 days averaged just a 7 percent difference to the initial listing price, while those that took more than 180 days to sell had to accept an average of nearly 20 percent difference to their initial listing price. In a HomeLight survey of top real estate agents across the country, 77 percent identified overpricing as the most common error that leads to homes sitting unsold. It’s the classic seller trap: hold out for the number you want, and end up with far less.
Stale Listings and the Psychology of Buyer Fatigue
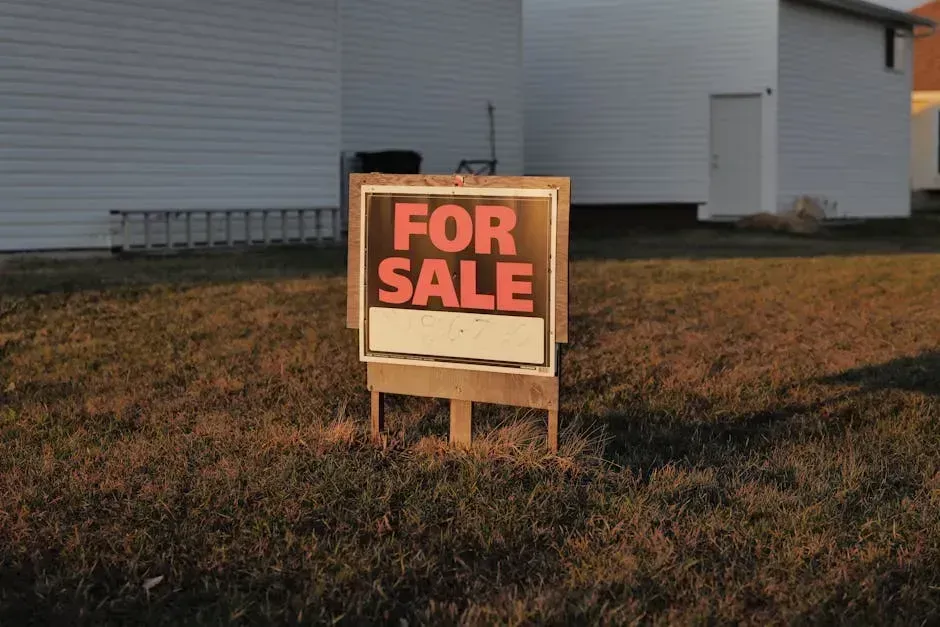
Once a large home lingers on the market too long, something damaging happens to its reputation. Buyers start to wonder what is wrong with it, even if the answer is simply that it was priced too high from day one. More than half of all homes for sale – 54.5 percent – had sat on the market for at least 60 days without going under a contract of sale, the highest share for any November since 2019 and up nearly 50 percent from the year before.
Ironically, dropping the price can sometimes have the opposite effect. Repeated cuts may signal desperation or make buyers suspicious about hidden issues. A home that started overpriced and keeps inching down can appear stale or like damaged goods. The longer your home sits unsold, the more red flags it raises. Buyers may wonder what’s wrong with the property. It is a vicious cycle, and large homes are especially prone to it.
Luxury Sales Are Collapsing

The upper end of the market – where the largest homes predominantly live – has experienced some truly historic softness. This slowdown affected all corners of the market, including luxury. High-end home sales fell to their lowest level since at least 2013. That is not a minor correction. That is a decade of progress being erased in a single cycle.
Many luxury buyers are adopting a wait-and-see approach because of volatility across financial markets and shifting tariff policies. These high-end buyers often sell stock to help with down payments, but many pressed pause on their home search when the stock market tumbled. One Redfin agent in Portland noted that buyers looking at homes from $1.2 million up are almost non-existent right now. Even in nice areas, high-end homes are selling really, really slow. Honestly, that says a lot about the current mood.
Vacation Homes and the Geography of Emptiness

Not every vacant large home is a failed sale. A significant chunk of them were never meant to be primary residences at all. Nearly one-third of vacant homes in the U.S. are vacation homes for seasonal or recreational use. The cities with the highest percentage of vacant homes as vacation homes include Scottsdale, Arizona along with Miami Beach and Pompano Beach, Florida.
Florida metro areas have the highest housing vacancy rates, with Cape Coral-Fort Myers at 38.7 percent, North Port-Bradenton-Sarasota at 23.7 percent, and Miami-Fort Lauderdale-West Palm Beach at 14.7 percent leading the list. While these properties can be lucrative for investors, they tighten the housing supply for full-time residents, especially those with moderate incomes. The result is a geographic lottery – enormous homes idle in warm-weather markets while families elsewhere can find nothing.
The True Cost of Ownership Has Become Unbearable
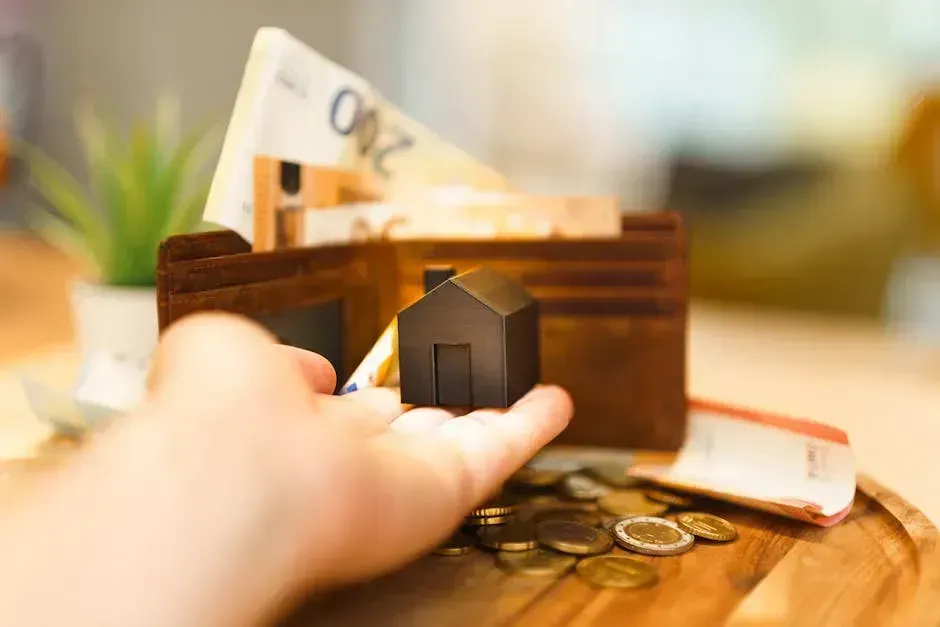
Even buyers who can theoretically afford a large home are discovering that the mortgage is only the beginning of the financial story. With rising costs for utilities, maintenance, insurance and property taxes, the total costs for homeownership are far more than just mortgage principal and interest payments. According to a mid-2025 update by Bankrate, these extra costs for a single-family home add an average $21,400 per year, up 18 percent from just one year ago.
Adding the cost to finance the median-priced single-family home of about $2,200 per month, the total median cost of homeownership rises to approach $4,000 per month. Renting a typical single-family home in May 2025 was $2,296 per month, or over 40 percent less. It is largely due to this cost differential that so many would-be homebuyers are electing to rent, even if they have the income to buy. For large homes with high utility bills and property taxes, that math is even more punishing.
Shrinking Preferences: Buyers Are Choosing Smaller
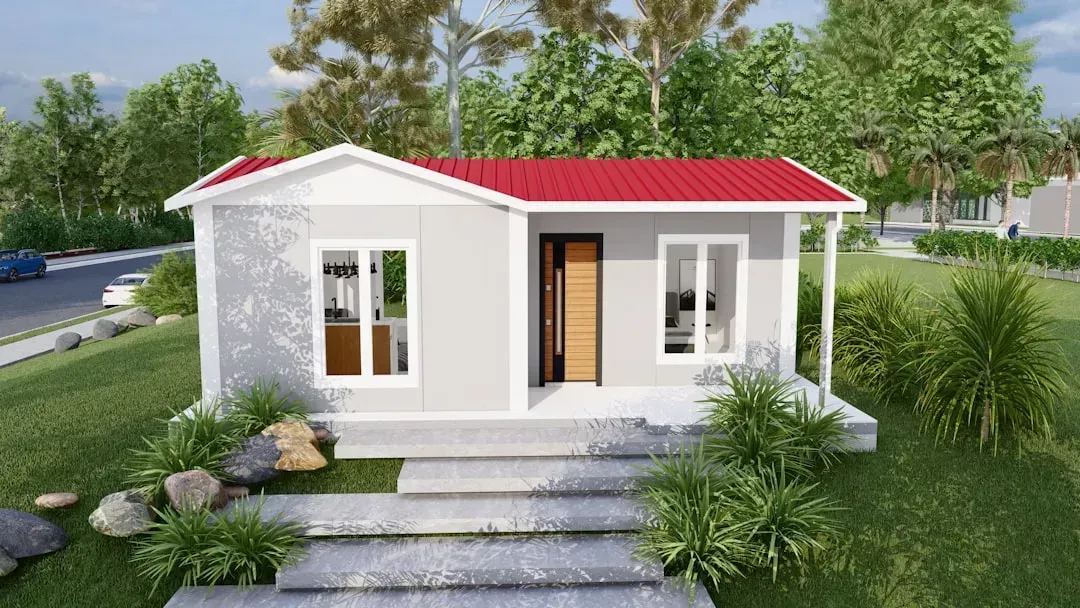
There is also a quieter cultural shift happening that deserves attention. Today’s buyers, even affluent ones, are increasingly not interested in the oversized square footage that defined aspirational homeownership in the 1990s and 2000s. Smaller homes continue to gain popularity among luxury buyers in 2025, and it’s not just about saving money – it’s a lifestyle choice. Recent data from the U.S. Census Bureau confirms this shift, with the average new home size dropping from 2,314 square feet in Q4 2022 to 2,169 square feet in Q4 2024.
The price gap between new and existing homes has narrowed significantly, with a 4 percent premium in 2024 compared to 28 percent between 2015 and 2019, partly due to a reduction in the median size of new homes from 2,519 square feet in 2015 to 2,158 square feet in 2024. Affluent buyers are prioritizing convenience and financial flexibility, seeking homes that require less maintenance without sacrificing high-end finishes. The era of the mega-mansion as a status symbol seems to be quietly fading.
What Happens Next: Signs of Slow Change
There are some early signals that the gridlock is beginning to ease, though nobody should expect a sudden transformation. Several years of higher interest rates have reshaped the mortgage-rate distribution. As of 2024 to 2025, the share of mortgage holders below 3 percent is now roughly equal to the share above 6 percent, and by early 2026 more mortgage holders likely carries a rate above 6 percent than below 3 percent. This shift matters because it means the payment advantage of staying locked in is weakening.
After nearly doubling in the last decade, J.P. Morgan Global Research sees U.S. house prices stalling at 0 percent growth in 2026, with a slight improvement in demand likely offsetting any increased supply. Around 20 percent of resale listings have seen price reductions, the highest share since 2016. Sellers of large homes are finally starting to blink. Whether buyers will meet them in the middle remains the central question of the housing market heading further into 2026.
The sight of empty large homes in a country where so many people can’t find adequate housing is one of the sharper ironies of today’s economy. It isn’t caused by any single villain – it is the compounded result of pandemic-era rate decisions, aging demographics, investor behavior, and plain old stubbornness about pricing. What do you think should change first? Drop your thoughts in the comments.